
Zacory Ruiz
Published on July 5, 2025
Preamble
Our mission at the Ruiz Report is simple: we help you make your money when you buy.
Whether that's by educating you about your local real estate market through the in-depth reporting on our blog, or by connecting you with one of our partner Realtors when you work with us, understanding your local real estate market is one of the most important aspects of buying or selling a home.
Why? Because it influences both sides of the same coin: Buyers want to offer a price that the Sellers will accept without overpaying, and Sellers want to make sure that they're not leaving any money on the table when they accept an offer. In short, market knowledge is power!
Still, it's often the case that while facts tell, emotions sell in real estate. This is nothing new, and that dynamic holds true for almost all purchases, but every real estate deal you're a part of is probably going to be among the largest single financial transactions of your life, so you'll want to have your wits about you!
We only aim to help change the balance between emotions and the data because buying or selling a home is an incredibly emotional purchasing decision, and rightfully so.
However! Left unchecked, your visions of future sunset family dinners on that beautiful back porch or the pride you'll feel hosting friends in your new open-concept kitchen/living room area can be dangerous! The emotional part of your brain is prone to hijack the whole operation and before you know it you'll be placing an above asking price offer, waiving inspections, and straining your budget for years to come.
Sellers don't have it much easier, and truth be told they usually have it a bit harder since they're probably negotiating a separate home purchase at the same time. It can be very exciting when the offers start rolling in (or stressful if they don't!), and it's much harder to stick to your plan when you're handed a pre-approved or cash offer! Only a strong sense of the market and how your home fits into it will give you the confidence to say "no" when necessary and allow you to wait for the right offer.
Well! Hopefully we've made our case, so let's get down to business! Here's a quick breakdown of the content to follow for Buncombe County, NC, in June,, 2025:
Table Of Contents
At A Glance:
How To
Whether you only have a moment to check the latest stats or you're just looking for the monthly and yearly breakdowns, the At A Glance sections should be your go-to's. You can get a great sense of the market just by looking at the numbers and colors in each section.
Each call-out has a very simple layout that remains the same on every report:
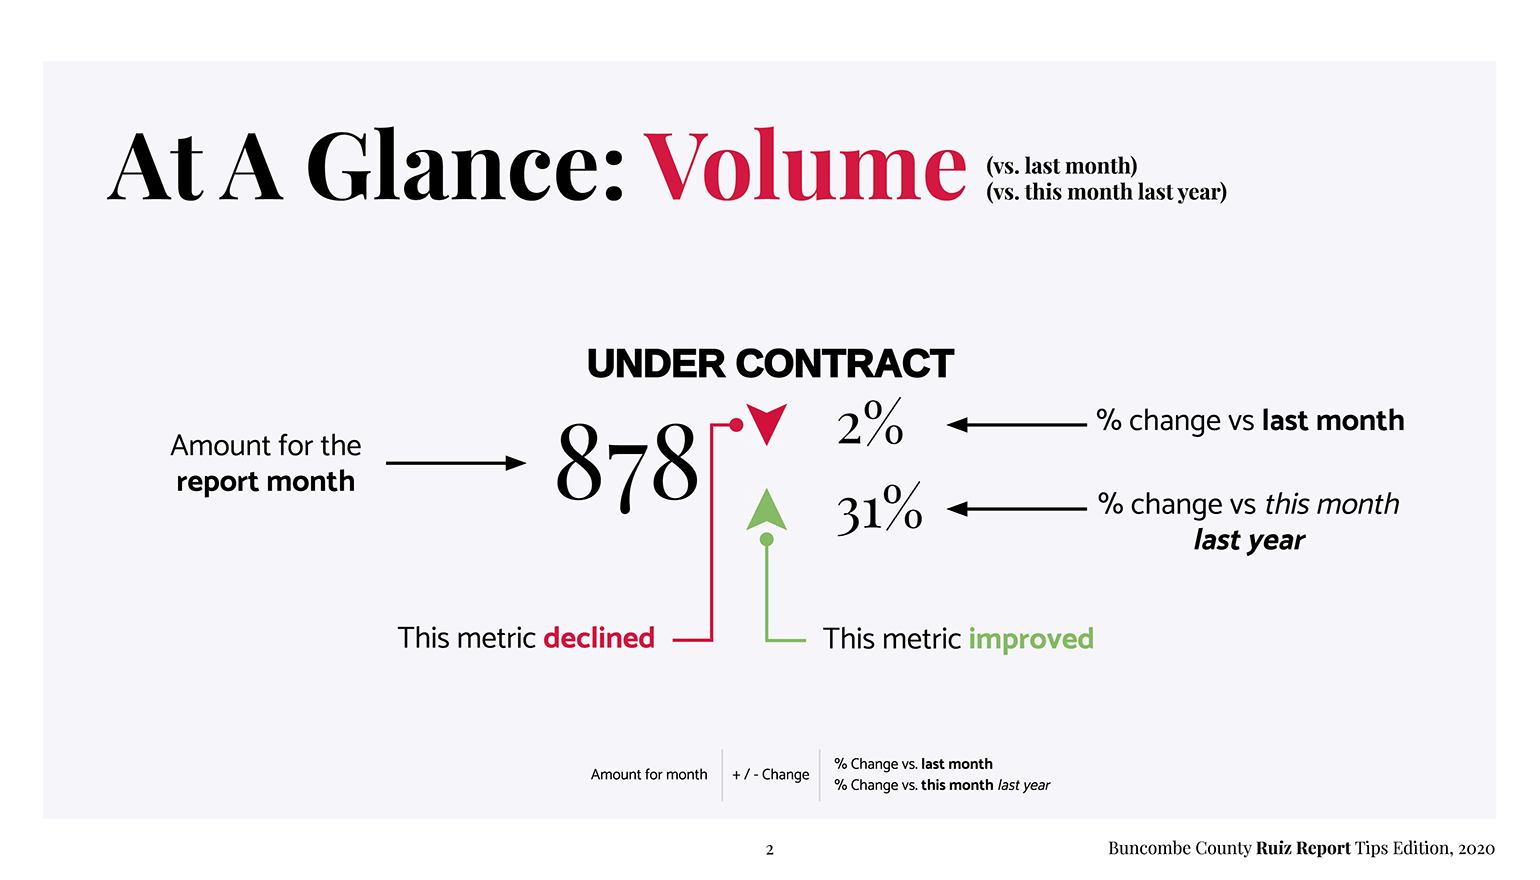
A green arrow means that metric improved and a red arrow signifies that it declined. This is not to be confused with increases or decreases. For example, more new listings are generally a good thing (green up arrow) while more days spent on the market (DOM) are generally bad (red up arrow). The color will tell you the basic good/bad and then the %-change will tell you how good or bad.
See something that piqued your interest? Each of these call-outs are taken directly from their graphical representations in the proceeding sections - just jump ahead to dig in deeper!
At A Glance:
Activity
503
319
305
Buncombe added 184 more new listings to the market than it took off (put under contract), which increased the overall supply. Home sales (closings) increased in June, just remember that many of those homes went under contract in a previous month.
At A Glance:
Velocity
29
2,024
6.08
The total number of active listings increased 5% compared to May, 50% of homes went under contract in 29-days or less, and at this rate there's about 6.08-months of supply to go around. June was a Balanced market.
At A Glance:
Pricing
98%
$609k
95%
The average price of a home in Buncombe County was $-22k less than it was this time last June. On average, properties sold for 98% of their list price at the time the offer was made, and 95% of the price they originally listed for.
Volume & Activity
Regardless of how many available listings you see when you search for a home, that is only a fraction of the month's actual inventory since it is just a picture of the market at that moment in time. There is significantly more real estate available throughout the month, and the chart below tells that story.
We count total volume and activity for the month as a combination of 3 factors:
- Total Active Listings - these homes are readily available for sale (at the right price!). This is a Ruiz Report exclusive metric and it is the only true measure of a market's inventory. We calculate this metric by taking a daily snapshot of the market to find the total number of homes that were actively for sale at any given point during the month.
- Total Homes Under Contract - these homes are no longer available for sale to the general public, but they're still very much a part of the month's real estate activity. They include homes that went under contract during the month as well as those homes that were still under contract from a previous period. Not all contracts end at the closing table (so don't overlook submitting backup offers!), and pending home sales are used as an effective tool to gauge the market's appetite.
- Homes Sold - these homes are the definition of the month's volume. Even though they most likely went under contract in a previous month, their sale during this period provides the hard numbers used for every kind of on-going deal negotiation. For example, as a Seller it is much easier to price a new listing when the neighbor's or a comparable home just sold, and recent sales should be used to get a feel for the strength of your listing's price (or the need of a price reduction...). As a Buyer, you can confidently place a well-informed offer using recent sales, or you can (and should be!) monitoring recent sales to see how likely the Sellers are to agree to your requested due diligence concessions. All of our partner agents take this data-driven approach when you work with us 😉
Volume & Activity Key Takeaways
The number of active listings increased by 5% in June. Total Active listings, the number of properties listed for sale at any point during the month, was up 62% compared to last year.
Total homes under contract remained flat from last month, but Buncombe had 4% more homes under contract in June than it did this time last year.
Overall volume was up 3% from from last month and up 36% from this time last year.
New Listings & Pendings
If new listings are the hand that giveth in the real estate market, then pendings are the hand that taketh away. The chart below is a very useful way to gauge the market's turnover (the rate at which Buncombe County is replacing its inventory of homes for sale), and it's the easiest way to explain our current low inventory environment.
You see how the green line (homes that went under contract, aka pendings) is often near the top of or above the red bars (new listings)? What that's telling us is that Buncombe County's market is barely listing enough new homes to meet demand, and often times it's actually taking more homes out of the available inventory than it's putting back in!
Here's a market prediction you can take to the bank: until the red bars (new listings) are consistently AND significantly higher than the green line (homes that went under contract), supply and demand is going to keep the real estate market ultra competitive.
If you're a budding investor or developer then get out there and build us some homes!
Listings & Pendings Key Takeaways
New listings decreased 28% from last month, but were up 13% from last June's numbers.
4% less homes went under contract, and Buncombe had less homes going under contract than this month last year, down 2%.
Keeping an eye on the year-over-year change in homes under contract is a useful way to see how the real estate market is faring during the pandemic recovery.
Home Prices
If you read the previous section on New Listings & Pendings then you can probably guess that I don't see prices going down until the supply of homes increases to meet the demand, and the chart below seems to agree.
Prices can and do fluctuate month to month, and they tend to move in a seasonally adjusted manner as well (for example, prices sometimes cool off in winter and pick back up in spring). Before jumping to any conclusions when making your own price predictions it's important to keep in mind that you're looking for abnormal trends, of two or more consecutive months, and make sure that they don't look like last year's price chart!
This is why all of our charts include 15-months of data - we like to show this time last year as well as the two previous months to help spot seasonal trends.
Also important to keep in mind is the difference between the median and average. The median price is the “middle price,” meaning half of the homes sold during the month were less expensive and half were more expensive than the median value (which was ~$509k for Buncombe County in June,, 2025).
The median prices often better represents the prices you're likely to see in the market since very expensive or very inexpensive homes tend to skew the average one way or the other.
Still, the average price is a very useful metric and it is calculated by totalling up all of the closing prices and dividing that value by the number of homes sold. The utility of the average is especially apparent when analyzing the difference between the average and median prices because it tells us if the market is dominated by higher-end or more affordable homes.
Home Prices Key Takeaways
The average home price in Buncombe County remained flat , but homes were valued 3% lower compared to last June.
The extremely limited supply is at least one factor driving prices up, and the positive home value appreciation trend seems to be holding despite global uncertainty.
The consistently higher average vs. median home price tells us that Buncombe's high-end market is strong, with prices significantly higher than the rest of the market.
Days On Market
If you could only look at one metric to see how well a listing is doing, then it would be its Days on Market (DOM). DOM is by no means a foolproof metric, and some Sellers have been known to adopt a pricing strategy that encourages a quick sale (or bidding war!), but it is safe to say that, in general, the longer a home sits on the market, the louder the market is speaking.
Of course this doesn't apply in all circumstances, but if comparable homes are selling faster, especially if they're priced below your own, then all signs are pointing to a price reduction (even when dealing with a unique property, hence the emphasis on comparable).
If there are no comparable homes then you've got to rely on your sense of the market (congrats, you're educating yourself in the right place!), but assuming your marketing is on point with great pictures and a property description that sells, then your price likely needs to come down (and not $1 to manipulate alert emails, it needs a legitimate price reduction to show potential Buyers you mean business!).
This also plays into the distinction between the average list to sale price ratio and the average original list to sale price ratio. The list to sale price can also be thought of as the price the home sold for once it was priced accordingly, while the the original list to sale is sometimes the difference between how you and your Realtor priced the home vs. how the market priced your home.
As always, each metric is two sides of the same coin, so if you're a Buyer and you're interested in a home that's been on the market longer than the moving averages, then you should feel confident placing an offer for less than the asking price, so long as you provide your justification.
Back to facts telling and emotions selling in real estate, emotions can also prevent a sale!
Realtors are obligated to present all offers, but we all know that only respectful offers get
serious consideration. Make sure your Realtor approaches a below asking price offer delicately
and you might just be able to score a deal that others have overlooked!
(Yes, this is the kind of data-driven offering advice our partner Realtors provide when you
work with us!)
Days on Market Key Takeaways
On average, homes took 3-days longer to go under contract than they did in May, and the median days it took to sign a purchase contract was 29-days (!!!).
Homes valued between $200k-249k sold fastest in June, with a median 5-days on the market, followed by homes valued between $200k-249k, which took a median of 7-days.
Homes in Buncombe are selling quickly due to a combination of extremely low inventory and high demand for homes.
Contract to Close
Your Realtor and the relationship you build with them can have a direct impact on almost every metric we track, except this one (more or less).
Contract to close time is the time it takes for a listing to close after it goes under contract. It's important to know this metric to plan things like inspections and your move-in or move-out date (or even to coordinate your move-out date with your new move-in date!).
Your closing attorneys' schedule and the Buyer's lender (unless they're buying cash) will have the greatest say here. With that in mind, if you're a Buyer and you're submitting an offer you should check in with your attorney and lender before setting a closing date!
The only time Realtors get in the way with this is if they fail to make the home available for the relevant inspections as a list agent, or if they fail to schedule them as a Buyer's agent, or if either schedules their clients' signing too late in the deal. As they always said in the Marines, "you can delegate authority but you cannot delegate responsibility," so even though your Realtor should be on top of this it doesn't hurt to mark important dates in your calendar with alerts 2-days out just in case.
Contract to Close Key Takeaways
Contract to close time took an average of 0-days None compared to last month, which was 0-days None compared to last .
Homes valued greater than $2M took among the longest to close. June closings data put that segment at around 73-days, on average.
Homes valued up to $199k closed fastest, closing in ~19-days, on average.
Contract to Ca$h
If Contract to Close is used to plan the logistics of the sale, then Contract to Ca$h is used to plan how you're going to spend all that money you just made! 🎉 🥳 🎉
This is our only Seller-focused metric, and if you're listing your home in Buncombe County then it allows your agent to say something along the lines of:
"As long as we remain on the same page and listen to the market, the average time it takes from the moment we list your home to the moment you cash your check at the closing table is about 90-days.
That's not bad, but I doubt you just want an average home sale experience, so I'm hoping to be among the 50% of listings that made it to the closing table in 57-days or less. Sound good?!"
That's how confidently your Realtor offered their services to you, right? And that's just the Buncombe County average, Realtors who subscribe to our personalized market reports get access to each metric by price range to add even more value to your specific situation.
Contract to Ca$h Key Takeaways
Sellers got paid an average of 3-days faster after listing their homes according to June sales data, and 15-days faster than Jun, 2024.
This overall increase was a due to increases in both time spent during the contract to close process as well as time spent on the market (DOM).
Homes valued between valued between $900k-999k sold fastest, averaging 50-days, followed by the valued greater than $2M price range which took 190-days, on average.
Wrappin' Up!
According to the National Association of Realtors, 82% of Sellers went with the first agent they contacted! I can confidently say that 82% of Realtors do not understand the market as well as our Ruiz Report partner agents do, and hopefully this article makes that case.
If you're into this type of analysis and think your Realtor should be too then you should work with us! I personally take a data-driven approach to real estate with my clients and my Ruiz Report partner Realtors do too. I'd love to either work with you directly or to match you with the best Realtor in our network for your unique situation.
I'd also highly encourage you to sign up for our newsletter to get the Ruiz Report delivered right to your inbox every month, to read our blog for our ever-growing resource of expert market analysis to make sure you're staying current with both the "macro-market" as well as the "micro-market!"
Thanks for your time and good luck out there!